Progress without Poverty
Page 4 of 7
Private and Public Property
In the primary division of wealth identified above we may see a just basis for both private and public property. Private property can be seen to have arisen from the work of individuals or firms whilst public property has its origin in the actions of the community acting as a whole. A natural and just source of public revenue may thus be seen to be the economic rent of land.
Current Revenue Collection
We now explore the effect of collecting public revenue in the way it is currently carried out – through taxes levied upon all productive enterprises and individuals. We use the same economic model and hypothetical community as before and assume that taxes are collected from each firm or individual in proportion to the value added on their site. In the UK today taxes amount to around 40% of the total value added by all productive activity or GDP so this proportion has been assumed in the model illustrated in Figure 5. Another feature of current society however needs to be incorporated into our model – the fact of full land enclosure. This means that a claim is exercised on each and every site such that any firm wishing to engage in productive work is obliged either, to hold a recognised claim to the site themselves, or pay another (a landlord) for a tenancy.
Consider now the relationship between the firm and its landlord. It hardly needs pointing out that the landlord is in a strong bargaining position – the firm needs his (or an equivalent) site far more than the landlord needs a tenant – particularly where the landlord can hold the site out of use without incurring any cost. If he wants any income however he must let the site to a tenant but he cannot charge him more than the tenant firm can afford to pay and stay in business. He will of course generally charge as much as he can however, leaving the tenant firm with just sufficient to pay the wages, interest and profit that is required to engage the requisite labour, capital and enterprise.
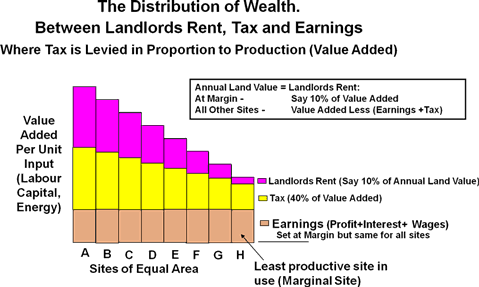
Figure 5
In Figure 5 we have assumed that at the margin ‘H’, the landlord’s claim amounts to 10% of the value added on that site leaving the firm with 50% after tax at 40% has also been paid. If we now regard this as the firm’s ‘earnings’ we see that it represents the least that people within the firm are prepared to accept. It does not relate directly to the product of their efforts and enterprise or the amount and quality of the capital they have employed but is a residual sum left after the tax man and the landlord have exercised their claims. We should now note the situation on each of the other sites. Their landlords also have, in general, no reason to claim any less than the most they can get. Thus they will now absorb all that remains after the earnings and taxes on value added have been taken. Tax, we have noted is a fixed proportion of the value added (40%), leaving an ever increasing share available for the landlord to claim on each succeeding site. We may note how the difference in landlords’ claim that arises between sites exaggerates the differences in Value Added that naturally arise between sites. The critical points to note however are firstly that it is the impact of taxation and landlord’s claim at the margin that depresses the general level of earnings throughout the economy. Secondly, that this renders sites that would otherwise be viable, unviable or sub-marginal and thus unproductive. Thirdly, those even normally productive firms, on any location, may be rendered only marginally viable with little scope to absorb any decline in market conditions.
Modern Taxation and Economic Theory
We may now explore the impact of modern taxation policies against a more recent and contemporary body of economic theory. Here we shall use the theories of supply and demand as they relate to the markets for particular goods and services.
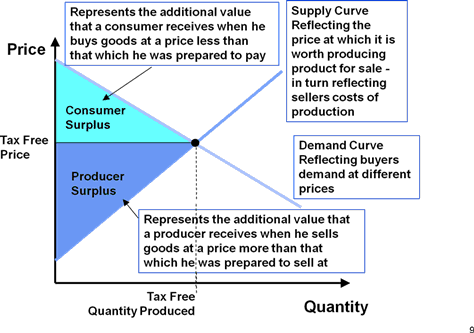
Figure 6
Figure 6 represents the conventional view for goods and services that are relatively elastic i.e. the quantity that will be bought and sold in the market is quite sensitive to price. Thus where Price is represented on the vertical axis and the Quantity bought and sold is represented on the horizontal axis, the ‘Demand Curve’ is shown sloping in a downwards direction from left to right, the demand for the item being shown to reduce as its price increases. In contrast the ‘Supply Curve’ is shown sloping upwards from left to right indicating how if the market price of the item is seen to rise more supply will be forthcoming. New suppliers may be tempted into the market and existing suppliers may be encouraged to produce more. It should be noted that the supply curve in fact reflects the firm’s costs of production, so that to the left hand side where the quantity is small, it ifndicates that few suppliers, (with low costs) would find it profitable to produce the item for sale at this low price. In contrast, the right hand side indicates that many more suppliers, with higher costs of production would find it viable at a higher sale price.
Where the two curves intersect indicates both the quantity of the item that will be bought and sold and the ‘market price’ of that item assuming no external interference with the market. However under current circumstances there is invariably much interference in the form of taxation. This is shown in Figure 6. where it is indicated as a sum of money impacting from the left hand side Price axis as a ‘tax wedge’. We may note three important effects of the tax wedge. First, it increases the price of the item to the buyer. Secondly it reduces the price received by the seller. And thirdly it reduces the quantity that is bought and sold. Thus all those purchasers and suppliers to the right of the new quantity point are now to be disappointed. These buyers will now judge that they are unable to afford the item at the tax inflated price whilst the suppliers will find they cannot cover their costs at these tax reduced returns. Not surprisingly these losses are styled ‘Deadweight Losses’.
Economists generally acknowledge the existence of deadweight losses though they are not often high on their agenda and there seems little consensus with regard to their size, estimates varying from around 30% to around 100%. The UK treasury seems to be content with the lower figure at present and uses it when determining the true costs of infrastructure investment from public funds.
The supply curve indicated in Figure 6. is for goods and services where the quantity that is produced for sale by suppliers depends upon the market price of those goods and services. These will include most discretionary purchases (but not addictive items where hooked people are not deterred by price), virtually all labour services and of course enterprise itself.
We may now contrast this with an item that is inelastic i.e. the quantity produced is not basically linked to the price of the item. The key item of economic significance here is land. As the old adage reminds us ‘they are not making it any more’ and with very rare exceptions land is ‘given’ not ‘made’. It is a free gift of nature available to all mankind. Thus whilst we have become accustomed to the existence of a market in land, the actual amount of land in the country is not affected by the price of land.
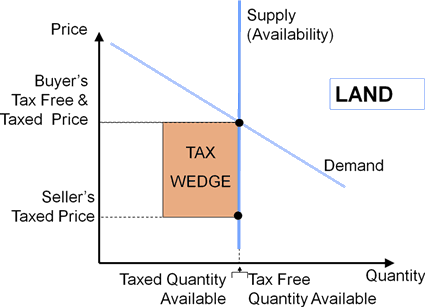
Figure 7
Figure 7. indicates the situation here where the supply curve is vertical. We may now see the effects of applying a tax on the price of land and note that the tax wedge does not affect the price that purchasers or users must pay but does reduce the amount that the supplier receives. However we should note here the likely effect on the quantity of land that land owners would make available to potential users as a result of a tax on land value. Owning and holding land out of use may be quite acceptable to many people who are attracted by the prospect of ever increasing capital land values. They are likely to get richer, not by working or enterprise but due to the passage of time and the growth of economic activity in the surrounding area – it costs them nothing. However the acceptability and attractiveness of this approach is likely to change if holding on to unused or underused sites carries with it a charge that reflects its value.
The effect of this is that more land is likely to be made available; the supply curve moves to the right and capital market prices reduce.